
Blood Sugar Chart: Blood sugar, also known as blood glucose, plays a crucial role in maintaining overall health and well-being. Monitoring and managing blood sugar levels are essential for individuals living with diabetes, as well as for those interested in maintaining a healthy lifestyle. A blood sugar chart is a valuable tool that provides insights into glucose levels over time.
What is blood sugar level?
Blood sugar levels, also known as blood glucose levels, refer to the concentration of glucose present in the bloodstream. Glucose serves as the primary source of energy for cells and is derived from the breakdown of carbohydrates consumed in the diet. Proper regulation of blood sugar levels is crucial for the normal functioning of the body.
The Role of Insulin
Insulin, a hormone produced by the pancreas, plays a vital role in maintaining blood sugar levels within a narrow range. When we consume carbohydrates, they are broken down into glucose and absorbed into the bloodstream. Insulin facilitates the uptake of glucose by cells throughout the body, including muscle, fat, and liver cells. It promotes the storage of excess glucose in the liver and muscles as glycogen and inhibits the production of new glucose by the liver.
Normal Blood Sugar Range
For individuals without diabetes, blood sugar levels are typically maintained within a relatively narrow range. Fasting blood sugar levels, which are measured after at least eight hours of not eating, are usually between 70 and 99 milligrams per deciliter (mg/dL). After a meal, blood sugar levels may rise temporarily, but they should return to the fasting range within two hours.
Target Blood Sugar Range for Diabetes
People living with diabetes aim to maintain blood sugar levels within a target range to prevent complications and promote overall health. The target range may vary depending on factors such as age, duration of diabetes, presence of other medical conditions, and individualized goals set by healthcare professionals.
What are the factors affecting blood sugar level?
Several factors can impact blood sugar levels, including:
- Diet: The types and amounts of carbohydrates, fats, and proteins consumed can affect blood sugar levels. Carbohydrates have the most significant impact as they directly contribute to the rise in blood glucose.
- Physical Activity: Exercise and physical activity can lower blood sugar levels by increasing glucose uptake by muscles and improving insulin sensitivity.
- Medications: Certain medications, such as insulin and oral glucose-lowering medications, help regulate blood sugar levels. However, their dosages may need to be adjusted based on individual needs and blood sugar monitoring.
- Stress: Hormones released during periods of stress can cause blood sugar levels to rise. Stress management techniques can help mitigate the impact on glucose levels.
- Illness: Illnesses, particularly those accompanied by fever or infection, can cause elevated blood sugar
What is a Blood Sugar Chart?
A blood sugar chart is a graphical representation of blood glucose levels over a specific period. It visually displays blood sugar readings, usually plotted against time, allowing individuals to track their glucose levels and identify patterns or trends. Blood sugar charts can be in various formats, including manual paper charts, digital tracking applications, or continuous glucose monitoring (CGM) systems.
What is blood sugar level for random and fasting blood sugar?
Blood Sugar Chart for fasting Blood Sugar Levels:
| Blood Sugar Level (mg/dL) | Interpretation |
| Below 70 | Hypoglycemia (low blood sugar) |
| 70 – 99 | Normal Range |
| 100 – 125 | Prediabetes (impaired fasting glucose) |
| 126 and above | Diabetes |
- Below 70 mg/dL: This range indicates hypoglycemia, which can cause symptoms such as dizziness, confusion, shakiness, and weakness. Immediate corrective action, such as consuming a fast-acting source of glucose, is necessary to raise blood sugar levels.
- 70 – 99 mg/dL: This is considered the normal fasting blood sugar range for individuals without diabetes. It indicates good glucose control and a healthy metabolism.
- 100 – 125 mg/dL: This range falls within the prediabetes category, indicating impaired fasting glucose. Individuals with readings in this range are at a higher risk of developing diabetes and should take preventive measures, such as lifestyle modifications.
- 126 mg/dL and above: A fasting blood sugar level of 126 mg/dL or higher on two separate occasions typically indicates diabetes. Further diagnostic tests may be necessary to confirm the diagnosis.
Blood Sugar Chart for Random Blood Sugar Levels:
| Blood Sugar Level (mg/dL) | Interpretation |
| Below 70 | Hypoglycemia (low blood sugar) |
| 70 – 139 | Normal Range |
| 140 – 199 | Prediabetes |
| 200 and above | Diabetes |
- Below 70 mg/dL: Similar to fasting blood sugar levels, a random blood sugar level below 70 mg/dL indicates hypoglycemia. Immediate action should be taken to raise blood sugar levels.
- 70 – 139 mg/dL: This is considered the normal range for random blood sugar levels. It indicates good glucose control and a healthy metabolism.
- 140 – 199 mg/dL: Readings within this range indicate prediabetes. Individuals should focus on lifestyle modifications to prevent the progression to diabetes.
- 200 mg/dL and above: A random blood sugar level of 200 mg/dL or higher, combined with symptoms such as increased thirst, frequent urination, and unexplained weight loss, often indicates diabetes. Further diagnostic tests are usually performed to confirm the diagnosis.
What is the role of blood sugar chart in diabetes management?
The role of a blood sugar chart in diabetes management is essential for individuals with diabetes to effectively monitor and control their blood sugar levels. It provides valuable information that helps individuals and healthcare professionals make informed decisions about diabetes management strategies, including medication adjustments, dietary modifications, and lifestyle changes. Here are the roles of a blood sugar chart in diabetes management:
Monitoring Blood Sugar Levels
A blood sugar chart allows individuals to regularly monitor their blood sugar levels. By recording and tracking their readings, they gain a comprehensive overview of their glucose control throughout the day, week, or month. Monitoring blood sugar levels helps identify patterns, trends, and potential problems in glucose control.
Identifying Patterns and Trends
Analyzing a blood sugar chart can reveal patterns and trends in blood sugar levels. Individuals can identify recurring highs or lows at specific times of the day, after certain meals, or in response to specific activities. This information enables them to make appropriate adjustments to their diabetes management plan, such as modifying medication dosages, adjusting meal timing, or changing exercise routines.
Assessing Treatment Effectiveness
Blood sugar charts serve as a tool to evaluate the effectiveness of diabetes management strategies. By comparing blood sugar readings before and after implementing changes to medication, insulin therapy, dietary habits, exercise routines, or lifestyle modifications, individuals can assess how well these interventions are controlling their blood sugar levels. This evaluation allows for informed decision-making and adjustments in the treatment plan.
Facilitating Communication with Healthcare Professionals
Sharing blood sugar charts with healthcare providers enhances communication and collaboration in diabetes management. By reviewing the blood sugar chart, healthcare professionals can assess an individual’s glucose control over time, identify areas of concern, and provide tailored guidance or treatment recommendations. This collaborative approach ensures more accurate assessment and adjustment of the diabetes management plan.
Determining Hypoglycemia and Hyperglycemia
Blood sugar charts help identify episodes of hypoglycemia (low blood sugar) and hyperglycemia (high blood sugar). Detecting patterns of blood sugar fluctuations enables individuals to take immediate corrective actions, such as consuming glucose tablets or adjusting medication dosages, to prevent or manage these conditions effectively. Regular monitoring and prompt intervention reduce the risk of complications associated with extreme blood sugar levels.
Assessing Long-Term Glucose Control
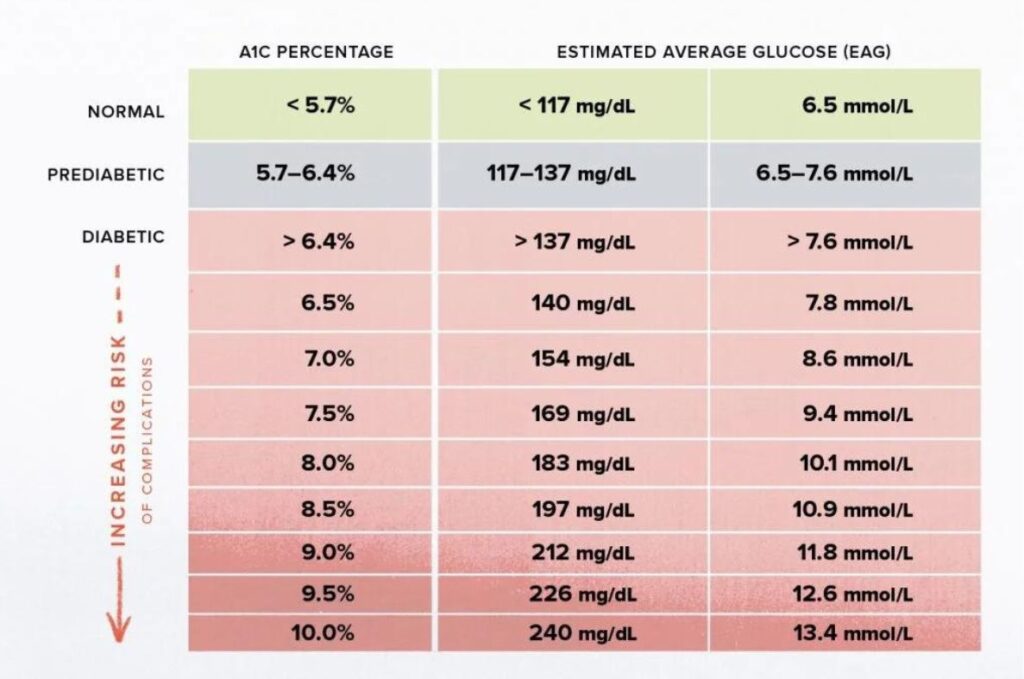
Blood sugar charts provide insight into long-term glucose control. For example, the average blood sugar levels over the past two to three months can be estimated using the measurement of glycated hemoglobin (HbA1c). By reviewing trends in HbA1c readings on the blood sugar chart, individuals and healthcare professionals can assess the effectiveness of the overall diabetes management plan and make adjustments as needed.
Guiding Medication and Insulin Adjustments
Blood sugar charts assist in fine-tuning medication and insulin regimens. By closely monitoring blood sugar levels and observing patterns or trends, individuals can work with their healthcare professionals to adjust medication dosages or timing. This ensures that the medications are effectively controlling blood sugar levels while minimizing the risk of hypoglycemia.
Supporting Dietary Modifications
Blood sugar charts help individuals understand how different foods and meals affect their blood sugar levels. By analyzing the blood sugar chart after meals, individuals can identify which foods or combinations of foods cause significant blood sugar spikes. This information empowers them to make appropriate dietary modifications, such as reducing carbohydrate intake, choosing low-glycemic-index foods, or adjusting meal timing to achieve better blood sugar control.
Optimizing Exercise and Physical Activity
Blood sugar charts provide insights into the impact of exercise and physical activity on blood sugar levels. By monitoring blood sugar before, during, and after exercise, individuals can determine how different activities affect their glucose levels. This information helps them plan exercise routines, adjust carbohydrate intake
What are Blood Sugar monitoring techniques?
Monitoring techniques refer to methods and tools used to measure and track blood sugar levels in individuals with diabetes. Regular monitoring is essential for effective diabetes management, as it provides valuable information about glucose control and helps guide treatment decisions. Here are some of the commonly used monitoring techniques:
Self-Monitoring of Blood Glucose (SMBG)
Self-monitoring of blood glucose involves using a blood glucose meter to measure blood sugar levels at home. This technique requires a small drop of blood obtained by pricking the finger with a lancet. The blood is then applied to a test strip, which is inserted into the meter for analysis. The meter provides a digital reading of the blood sugar level within seconds.
SMBG allows individuals to monitor their blood sugar levels throughout the day, before and after meals, during physical activity, and at bedtime. It provides real-time information that helps individuals make immediate adjustments to their diabetes management plan, such as adjusting insulin doses, making dietary modifications, or taking corrective actions for low or high blood sugar levels.
Continuous Glucose Monitoring (CGM)
Continuous glucose monitoring involves wearing a small sensor under the skin that measures interstitial fluid glucose levels continuously. The sensor sends glucose readings to a receiver or a smartphone via Bluetooth. CGM provides real-time glucose data, trends, and alerts for high or low blood sugar levels.
CGM systems offer more comprehensive glucose monitoring compared to SMBG. They provide a continuous stream of glucose data, including information on glucose levels during sleep and physical activity. CGM helps individuals understand their glucose patterns, detect trends, and identify potential hypoglycemia or hyperglycemia episodes. It can also provide alarms or alerts for high or low glucose levels, aiding in proactive diabetes management.
Flash Glucose Monitoring (FGM)
Flash glucose monitoring is similar to CGM but does not provide continuous glucose readings. Instead, it allows users to scan a sensor with a dedicated reader or smartphone to obtain a current glucose reading. FGM provides glucose data for the past few hours, including trends and patterns.
FGM offers a convenient and less invasive alternative to SMBG as it eliminates the need for finger pricks. Users can obtain glucose readings by scanning the sensor on-demand, making it more discreet and less disruptive to daily activities. FGM provides useful insights into blood sugar levels and trends, allowing individuals to make informed decisions about their diabetes management.
Urine Glucose Testing
Urine glucose testing involves collecting a urine sample and using test strips to measure the presence of glucose. This technique is less common nowadays due to its limitations. Unlike SMBG, urine glucose testing does not provide real-time information about current blood sugar levels. It reflects past glucose levels and is not as accurate as blood glucose testing methods. Urine glucose testing is more useful in specific situations, such as detecting ketones or monitoring glucose levels in individuals with gestational diabetes.
How to interpret a blood sugar chart?
Interpreting a blood sugar chart involves understanding the data presented and using it to gain insights into blood glucose control. Here is a detailed guide on how to interpret a blood sugar chart:
Understand the Blood Sugar Units
Blood sugar can be measured in different units, such as milligrams per deciliter (mg/dL) or millimoles per liter (mmol/L). Make sure you know the units used in the blood sugar chart you’re interpreting to avoid confusion.
Identify the Timeframe
Blood sugar charts often display data over a specific period, such as a day, a week, a month, or longer. Understanding the timeframe helps provide context for the blood sugar readings and patterns.
Recognize Target Ranges
Blood sugar targets vary depending on individual circumstances, including age, type of diabetes, overall health, and treatment goals. Consult with your healthcare provider to determine your specific target ranges for fasting, pre-meal, and post-meal blood sugar levels. These targets will serve as a reference for interpretation.
Look for Consistent Patterns
Scan the blood sugar chart for consistent patterns or trends. Note any recurring highs or lows at specific times of the day, after certain meals, or in response to specific activities. Identifying patterns can help uncover factors that contribute to blood sugar fluctuations.
Assess Blood Sugar Variability
Consider the variability of blood sugar readings. Spikes and dips in blood sugar levels can indicate inadequate glucose control. Assess whether blood sugar levels consistently fall within the target range or if they frequently deviate.
Analyze Fasting Blood Sugar
Pay attention to fasting blood sugar levels, which are measured upon waking or after an extended period without food (usually 8 hours or more). Fasting blood sugar provides an indication of overnight glucose control and insulin sensitivity.
Evaluate Pre-Meal and Post-Meal Blood Sugar Levels
Analyze pre-meal (also called pre-prandial) and post-meal (also called post-prandial) blood sugar levels. Pre-meal readings reflect blood sugar levels before eating, while post-meal readings indicate blood sugar levels after a meal. Comparing pre-meal and post-meal values helps assess the impact of meals on blood sugar control.
Consider Hypoglycemic Episodes
Check for episodes of hypoglycemia (low blood sugar) on the chart. Hypoglycemia can occur due to factors like excessive insulin or medication, delayed or missed meals, or increased physical activity. Identify any patterns or triggers for hypoglycemic episodes.
Track HbA1c Trends
If your blood sugar chart includes HbA1c readings, pay attention to the trends. HbA1c provides an average blood sugar level over the past two to three months and serves as an indicator of long-term glucose control. Monitor changes in HbA1c levels to evaluate the effectiveness of your overall diabetes management.
Consider External Factors
Consider external factors that may affect blood sugar levels, such as illness, stress, changes in medication, exercise routines, or dietary modifications. These factors can influence blood sugar readings and should be taken into account when interpreting the chart.
Seek Professional Guidance
Remember to consult with your healthcare provider for personalized interpretation and guidance based on your specific health condition, treatment plan, and goals. They can help analyze the blood sugar chart, identify areas for improvement, and make appropriate adjustments to your diabetes management plan.
Interpreting a blood sugar chart is an ongoing process that requires regular monitoring and communication with healthcare professionals. It helps you gain insights into your glucose control, identify trends, and make informed decisions to optimize your diabetes management.
| Homepage | Click Here |
FAQs Related to Blood Sugar Chart
The frequency of blood sugar checks and updating the blood sugar chart depends on various factors, including the type of diabetes, treatment plan, and healthcare provider’s recommendations. Generally, individuals with diabetes may need to check their blood sugar multiple times a day, such as before and after meals, and at bedtime.
Interpreting a blood sugar chart involves understanding the target blood sugar ranges, identifying patterns or trends, and comparing the readings with reference values. It is important to consult with a healthcare professional who can provide personalized guidance based on individual circumstances.
Target blood sugar ranges may vary based on factors like age, type of diabetes, and individual health goals. Common targets include fasting blood sugar, pre-meal blood sugar, post-meal blood sugar, and bedtime blood sugar. It is crucial to work with a healthcare provider to determine the appropriate targets for your specific situation.
If your blood sugar levels consistently fall outside the target range, it is important to consult with your healthcare provider. They can help assess the situation, identify potential causes, and make appropriate adjustments to your diabetes management plan, such as modifying medication dosages, adjusting meal plans, or suggesting lifestyle changes.